Ever felt lost staring at those wiggly lines on stock and cryptocurrency charts? Don’t worry, you’re not alone! These charts might seem intimidating, but they’re actually packed with valuable information that can help you make smarter investment decisions. This guide breaks down the basics, so you can navigate the world of investing with confidence.
Why Understanding Stock and Cryptocurrency Charts Matters
Stock and cryptocurrency charts are visual representations of price movements over a specific period. They show you how the price of an asset has changed, helping you identify trends, patterns, and potential opportunities. By learning to interpret these charts, you can:
- Make informed decisions: Avoid impulsive buys or sells based on emotions.
- Identify trends: Spot upward or downward momentum to capitalize on price movements.
- Manage risk: Set stop-loss orders and profit targets based on chart analysis.
- Improve your trading strategy: Combine chart analysis with other indicators for better results.
Types of Stock and Cryptocurrency Charts
Let’s explore some common types of stock and cryptocurrency charts:
Line Charts
The simplest type, a line chart connects closing prices over time. It’s easy to read and provides a general overview of price trends.
Bar Charts
Bar charts offer more detail than line charts. Each bar represents a specific period and shows the open, high, low, and closing prices.
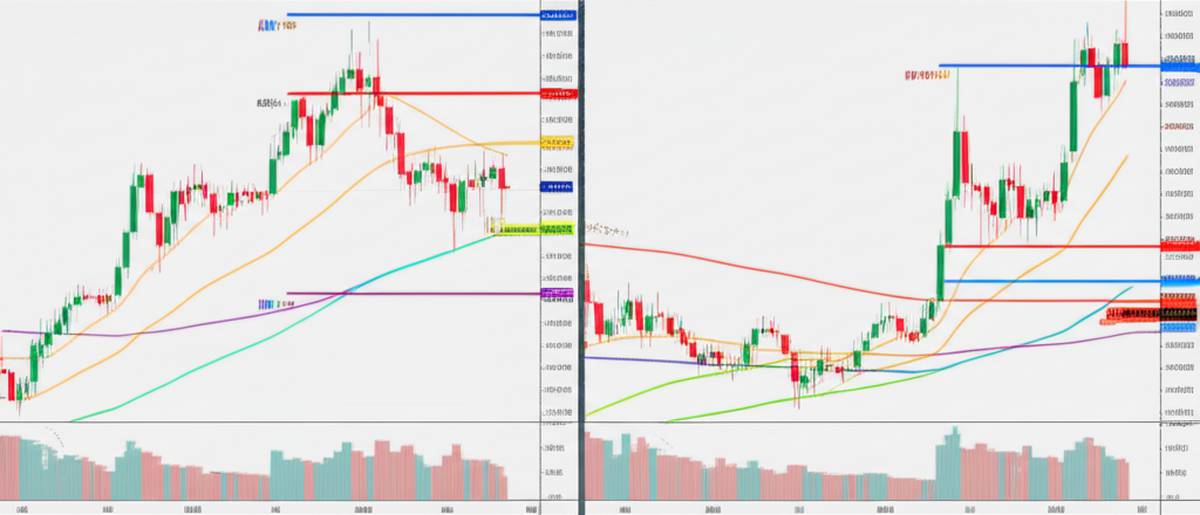
Candlestick Charts
Candlestick charts are widely used and provide a visual representation of price action. The body of the candle represents the difference between the open and close prices. Wicks or shadows extend from the body to show the high and low prices.
- Green or White Candle: The closing price is higher than the opening price (bullish).
- Red or Black Candle: The closing price is lower than the opening price (bearish).

Key Components of Stock and Cryptocurrency Charts
Let’s break down the essential elements you’ll find on most stock and cryptocurrency charts:
- Price: The vertical axis (y-axis) represents the price of the asset.
- Time: The horizontal axis (x-axis) represents the time period (e.g., minutes, hours, days, weeks).
- Volume: Volume indicates the number of shares or coins traded during a specific period. Higher volume often confirms price trends.
- Indicators: Technical indicators, such as moving averages, RSI, and MACD, can help you identify potential buy or sell signals.
Basic Chart Patterns
Recognizing chart patterns can give you clues about future price movements. Here are a few common patterns:
Head and Shoulders
A bearish reversal pattern that signals a potential downtrend. It consists of a peak (head) with two lower peaks on either side (shoulders).
Double Top/Bottom
A double top is a bearish reversal pattern, while a double bottom is a bullish reversal pattern. They indicate that the price has failed to break through a certain level twice.
Triangles
Triangles can be ascending, descending, or symmetrical. They represent periods of consolidation before a potential breakout in either direction.
Understanding these patterns helps you anticipate potential price movements and plan your trades accordingly. Remember to always use risk management strategies when trading.
Tools and Resources for Chart Analysis
Numerous tools and resources can help you analyze stock and cryptocurrency charts:
- TradingView: A popular platform with advanced charting tools and social networking features.
- MetaTrader 4/5: Widely used platforms for forex and CFD trading, with robust charting capabilities.
- CoinMarketCap/CoinGecko: Websites that provide real-time cryptocurrency price data and charts.
- Brokerage Platforms: Most online brokers offer charting tools as part of their trading platforms.
Explore these resources to find the tools that best suit your needs and trading style. Learn more about how to start your investment journey with Billionmode.
Tips for Reading Stock and Cryptocurrency Charts
Here are some tips to help you improve your chart reading skills:
- Start with the basics: Master the fundamentals before diving into complex patterns and indicators.
- Use multiple timeframes: Analyze charts on different timeframes (e.g., daily, weekly, monthly) to get a broader perspective.
- Confirm with indicators: Use technical indicators to confirm potential buy or sell signals.
- Practice, practice, practice: The more you practice reading charts, the better you’ll become at identifying trends and patterns.
- Manage your risk: Always use stop-loss orders to limit potential losses. Learn about wealth management strategies.
Remember that chart analysis is not an exact science. It’s essential to combine chart analysis with other forms of research and analysis to make well-informed investment decisions. Consult reputable financial resources like Investopedia to further your knowledge.
Billionmode is here to help you build a path towards wealth and freedom. Check out our blog for more helpful tips and resources!
Conclusion
Understanding stock and cryptocurrency charts is a valuable skill for any investor. By mastering the basics and practicing regularly, you can gain insights into price movements, identify trends, and make more informed trading decisions. So, embrace the challenge, dive into the world of charts, and unlock your potential for financial success!
FAQs
What is the best type of chart for beginners?
Line charts are often the best starting point for beginners due to their simplicity. Once you’re comfortable with line charts, you can move on to bar or candlestick charts for more detailed information.
How reliable are chart patterns?
Chart patterns are not always 100% reliable. They should be used in conjunction with other technical indicators and fundamental analysis. Always manage your risk and avoid relying solely on chart patterns.
What is the importance of volume in chart analysis?
Volume provides valuable information about the strength of a trend. High volume confirms a trend, while low volume may indicate a weak or unsustainable trend.